
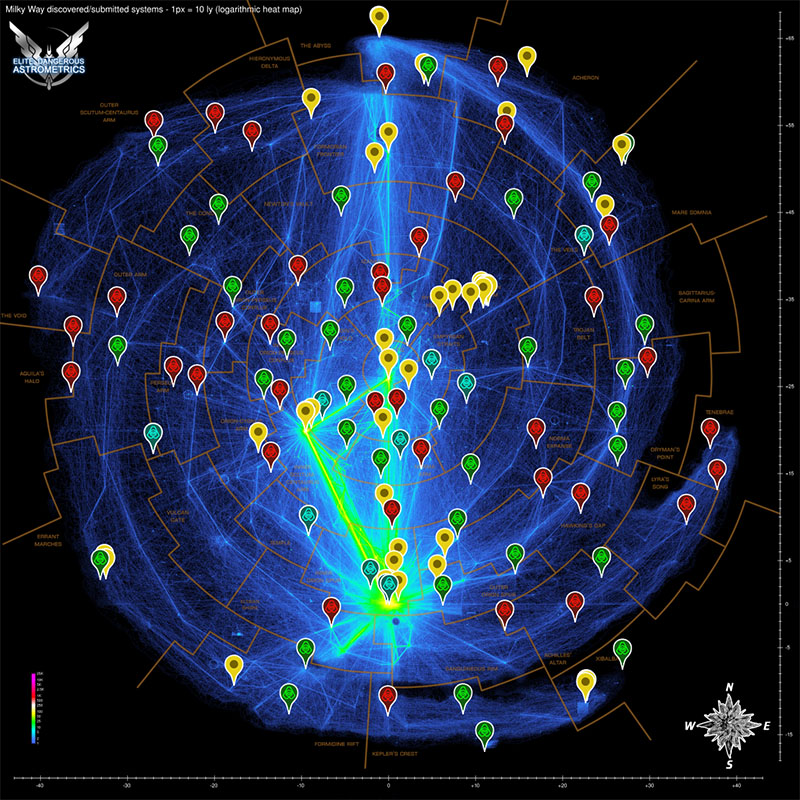
All charts and maps generated using data collected by EDSM. All data is based on scanned bodies, and/or visited systems, so the numbers can be influenced by commander activity as much as actual distribution. The unusual patterns that emerge from some of the specific filtered maps are largely due to quirks of StellarForge, and there can be large variations between the distribution patterns of certain mass codes or certain star classes.
Maps and spreadsheets are updated once every two days.
* Note that the gaps along the center of the map, and some of the strange square regions, are entirely due to quirks in the StellarForge. It suppresses the creation of certain kinds of stars and systems within these regions, and therefore these gaps are representative of what is actually in the game.
Spreadsheets for less common types of bodies. These are updated on the same schedule as the star maps.
* Note that the columns in these spreadsheets can change in the future. Their order might be altered, or new columns added. If you want to automate tasks, please try to detect the column order in your script.